Introduction to Clustering in Machine Learning
Clustering is an important unsupervised machine learning approach. Unsupervised learning uses data without labels or classifications. Instead of forecasting outcomes, clustering groups comparable data points to reveal patterns and correlations.
Data mining, anomaly detection, picture compression, and consumer segmentation use clustering. The goal is to uncover inherent structures in the data by splitting it into subsets with more related points than others.
This article covers clustering ideas, methodologies, applications, problems, and evaluation.
Key Concepts in Clustering
Similarity and Distance Measures
Measurement of data point similarity or distance drives clustering. Distance measures measure how far away or similar two data points are. Distance metrics include:
- Euclidean Distance: The straight-line distance between two points. It’s frequent in clustering.
- Manhattan Distance: Absolute coordinate discrepancies.
- Cosine Similarity: Used for text and high-dimensional data, cosine similarity measures the angle between two vectors.
- Jaccard Similarity: For binary or categorical data, Jaccard Similarity measures finite sample set similarity.
Types of Clustering Algorithms
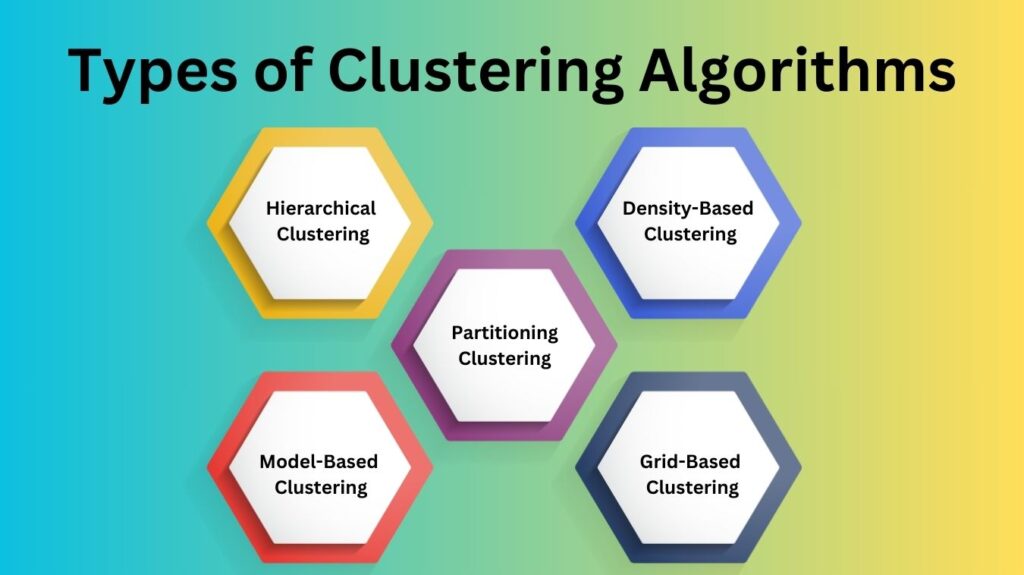
How clustering algorithms group data determines their classification. The five main types:

Partitioning Clustering
Set number of clusters are created by this procedure. Only one cluster contains each data point. A popular partitioning algorithm:
- K-Means Clustering: A popular clustering algorithm is K-Means. The sum of squared distances between data points and cluster centroids is minimized to partition data into k clusters.
Hierarchical Clustering
Hierarchical clustering creates a dendrogram of data. There are two methods:
- Agglomerative: In this bottom-up strategy, each data point starts as a cluster and is merged with others until a stopping requirement is fulfilled.
- Divisive: This top-down method starts with one cluster and recursively splits it into smaller clusters.
Density-Based Clustering
We aggregate densely packed points using this strategy. Low density points are outliers. Famous algorithms include:
DBSCAN (Density-Based Spatial Clustering of Applications with Noise): DBSCAN (Density-Based Spatial Clustering of Applications with Noise) recognises arbitrary-shaped clusters and is noise-resistant. Expanding clusters from core points with enough neighboring points (specified by a distance parameter) works.
Model-Based Clustering
Model-based clustering assumes mixed probability distributions create data. Categories of algorithms include:
Gaussian Mixture Models (GMM): GMM assumes data originate from several Gaussian distributions. Estimating parameters using the Expectation-Maximization (EM) process fits the model to the data.
Grid-Based Clustering
In grid-based clustering, space is partitioned into grids. Data point density inside these grids forms clusters. STING (Statistical Information Grid) algorithms are examples.
Determining the Number of Clusters
Sometimes, like K-means, the number of clusters must be pre-defined. Finding the right amount of clusters is difficult. Numerous techniques can determine the optimal cluster count:
- Elbow Method: The elbow approach depicts the sum of squared distances from each location to its centroid as a function of clusters. The “elbow” point where decrease slows is the optimal cluster number.
- Silhouette Score: Silhouette Score measures cluster separation. Well-formed and identifiable clusters have a better silhouette score.
- Gap Statistics: Compares the total intra-cluster variation for different cluster counts to the predicted variation under a random point distribution.
Applications of Clustering
A variety of fields use clustering. Notable applications:
- Customer Segmentation:
Marketing can utilize clustering to divide clients by purchasing behavior, preferences, and demographics. Personalized marketing can then target these segments. - Image Compression and Segmentation:
Clustering helps compress or segment images in computer vision. The K-means algorithm can compress an image by grouping similar colors, lowering its size while keeping quality. - Detecting Anomalies:
Database outliers can be found via clustering. Deviating transactions from data patterns might be recognized as suspicious in fraud detection. - Document Clustering:
Document clustering groups comparable documents by content. Grouping news articles or emails is common in information retrieval and recommendation systems. - Biological Data Analysis:
Clustering genes or proteins with similar activities or expressions in genomics and bioinformatics might reveal biological processes and disease mechanisms.
Challenges in Clustering
Clustering is effective but has drawbacks:
- Selection of Clustering Algorithm: Data type and clustering algorithm selection are critical. DBSCAN handles any cluster shape, while K-means assumes spherical clusters. The improper algorithm may yield meaningless results.
- High-Dimensional Data: With more features, clustering may lose effectiveness. The curse of dimensionality makes “distance” less comprehensible in high-dimensional domains, making most clustering methods perform poorly.
- Noise and Outliers: Outliers can dramatically impact clustering findings, notably in K-means. Aside from DBSCAN’s noise tolerance, outlier management remains difficult.
- Interpretability of Clusters: Clustering answers may not always be clear or actionable. To draw conclusions, clusters may need more analysis.
- Scalability: Large datasets can make K-means computationally expensive. More data requires more efficient clustering methods to accommodate the computational strain.
Evaluation of Clustering Results
Clustering methods are harder to evaluate than supervised learning with ground truth labels. Common evaluation methods:
Internal Evaluation Metrics:
These metrics evaluate clustering without labels based on cluster structure:
- Silhouette Score: Silhouette Score calculates how near points in one cluster are to surrounding clusters. A high silhouette score suggests clear clusters.
- Davies-Bouldin Index: A lower Davies-Bouldin score suggests better clustering because it assesses the average similarity ratio of each cluster to its most similar one.
External Evaluation Metrics:
External metrics require ground truth labels to test clustering findings against known labels:
- Rand Index: Cluster-ground truth similarity. It counts correctly grouped or separated data points.
- Normalized Mutual Information (NMI): Quantifies the information exchanged between the clustering result and true labels.
Conclusion
Machine learning relies on clustering to find patterns in unlabeled data. Clustering related data points reveals underlying structures that can improve decision-making, spur corporate ideas, and solve complicated challenges across disciplines. Every clustering algorithm has pros and cons. Selecting the proper algorithm depends on the data, problem, and desired results. Clustering is an effective unsupervised data analysis tool despite its drawbacks.
Clustering will become more versatile and efficient in handling varied real-world applications as machine learning and computational resources improve.
