
MongoDB’s Diagnostic Tools and Commands
MongoDB has various monitoring and diagnostic utilities and shell commands:
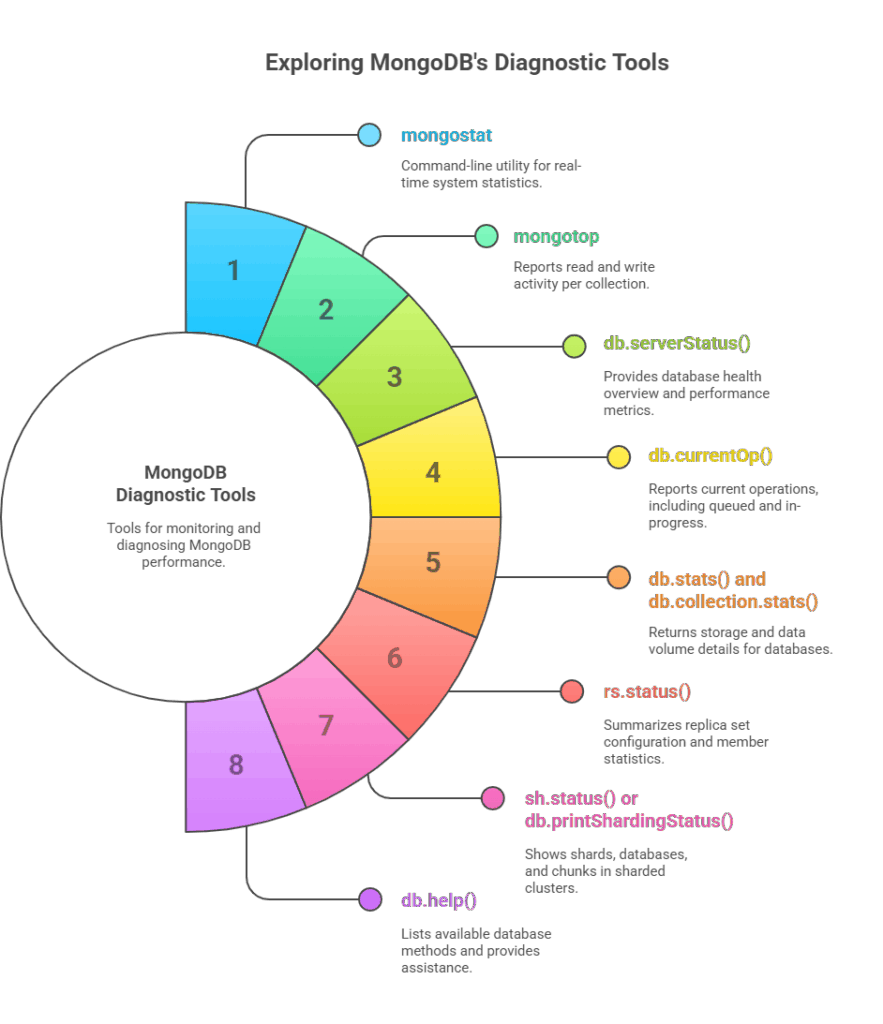
- mongostat: This command-line utility scans all active mongod instances and returns global system statistics. It provides a real-time view of a number of metrics pertaining to network activity, memory utilisation, and database operations.
- Metrics: The number of inserts, queries, updates, deletes, and cursors that have taken place since the last print is reported by mongostat. It also displays your lock percentage, which may indicate write capacity constraints or performance problems, as well as when you’re having page faults, which indicate memory pressure. mapped (the amount of memory that Mongod has mapped), vsize (the amount of virtual memory used, usually double the size of the data directory because of journaling), res (resident memory in physical RAM), netIn/netOut (network bytes in/out), and conn (number of open connections) are additional metrics.
- Usage: Mongostat automatically polls the server once every second. Mongostat 30 returns values every 30 seconds. Mongostat can detect and display statistics for all replica set or sharded cluster members with the –discover option.
- mongotop: This command-line program reports MongoDB instance read and write activity per collection. It checks that your application’s read and write behaviour meets its intent and doesn’t cause excessive writes or disc reads.
- Usage: Like mongostat, mongotop reports information every second by default, but you can set a different interval (e.g., mongotop 30). Additionally, it can be executed with –locks to provide database-specific locking statistics.
- db.serverStatus(): The mongo shell’s db.serverStatus() command gives a broad picture of the database’s health, including information on journaling, disc consumption, memory utilisation, connection, and index access. Performance remains unaffected and it returns rapidly. Monitoring tools like MongoDB Cloud Manager and Ops Manager frequently aggregate its data, even though it is rarely used directly in production.
- db.currentOp(): A mongod instance’s current operations, including those that are queued or in progress, are reported by the db.currentOp() method. Finding sluggish operations is much easier with this. You can also execute db.currentOp(true) to view statistics for system operations that are not in use. It should be noted that some lengthy internal processes, such as replication threads, are typical and should not be considered “false positives”.
- db.stats() and db.collection.stats():
- A document containing storage and data volume details for the current database, including storage usage, data amount, object, collection, and index counts, is returned by db.stats().
- Similar statistics at the collection level, such as object count, collection size, disc space consumed, and index information, are provided via db.collection.stats().
- rs.status(): For replica sets, rs.status() gives a summary of the configuration, status, and member statistics of the replica set. Verifying the correct replication settings and member connections is aided by this. Check optimeDate for primary-secondary replication latency.
- sh.status() or db.printShardingStatus(): These commands show shards, databases, and chunks in sharded clusters. This verifies data dispersion and sharding.
- db.help(): This general help command lists the available database methods when it is entered in the Mongo shell. Using db..help(), you can also obtain assistance on collection methods.
Importance of Reviewing Logs
For every MongoDB deployment, logging is the initial level of monitoring. Server actions and activity are reported by mongod and mongos instances to a log file or standard output.
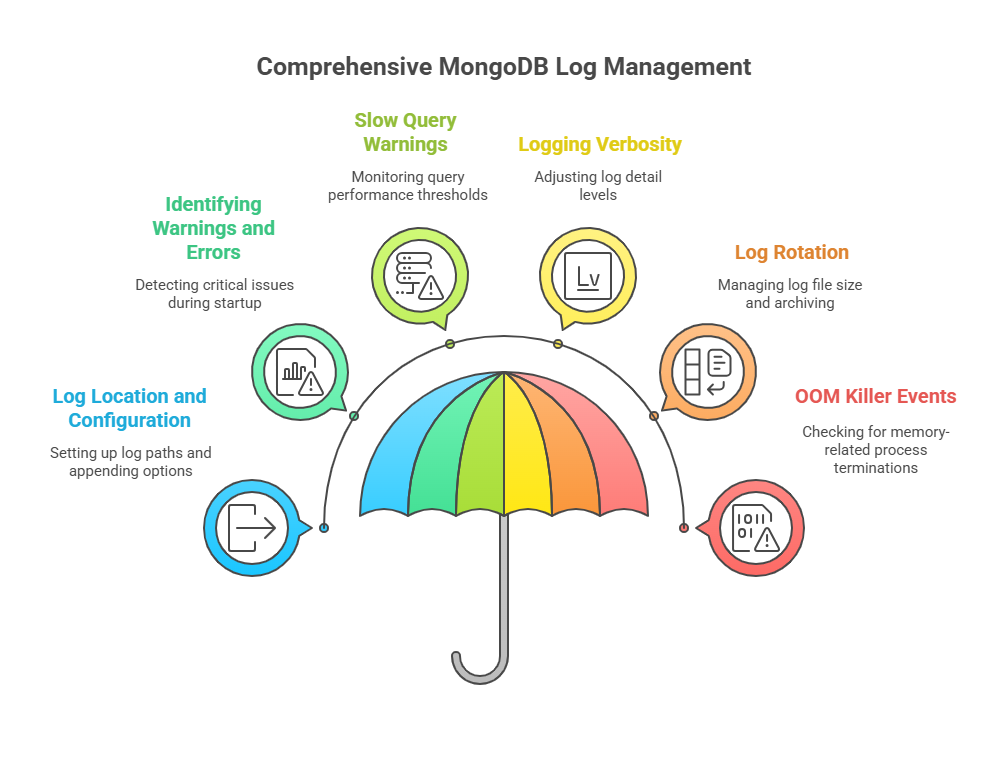
- Log Location and Configuration: Mongod transmits its logs to standard output by default. The –logpath option should be used to send logs to a file for production systems (e.g., /var/log/mongodb/mongod.log on Unix-like systems). Adding new information to the file rather than overwriting it is ensured by the –logappend option.
- Identifying Warnings and Errors: You should always check the MongoDB logs when you first start up after installation, upgrades, or crash recovery since they frequently include crucial cautions that can stop mistakes in the future. Having NUMA enabled (which can impair performance), operating on a 32-bit system (which restricts data to about 2GB), or having too few active file descriptors are a few examples of these warnings.
- Slow Query Warnings: If a query or other activity takes more than the normal 100 milliseconds, MongoDB logs a warning. This threshold can be changed by passing operationProfiling.slowOpThresholdMs to db.setProfilingLevel() or by using the –slowms server option. Using grep -E ‘+ms’ mongod.log to regularly search logs for these warnings provides a quick sanity check for performance issues.
- Logging Verbosity: Although a default log level is typically adequate for basic troubleshooting, you can boost verbosity (e.g., -vvvvv) for more comprehensive output, albeit this can result in very big logs and impact server performance.
- Log Rotation: Log files should be rotated on a regular basis for lengthy processes. The current log file is archived and a new one is started by MongoDB using the logRotate command or in response to a SIGUSR1 signal.
- OOM Killer Events: Look through your system’s kernel logs (/var/log/messages on Linux, for example) for messages pertaining to the “out-of-memory” (OOM) killer terminating mongod if a mongod process abruptly ends without obvious log problems.
MongoDB Optimisation and Monitoring
The following actions frequently entail more thorough research and optimisation after possible problems have been detected by basic monitoring and log analysis:
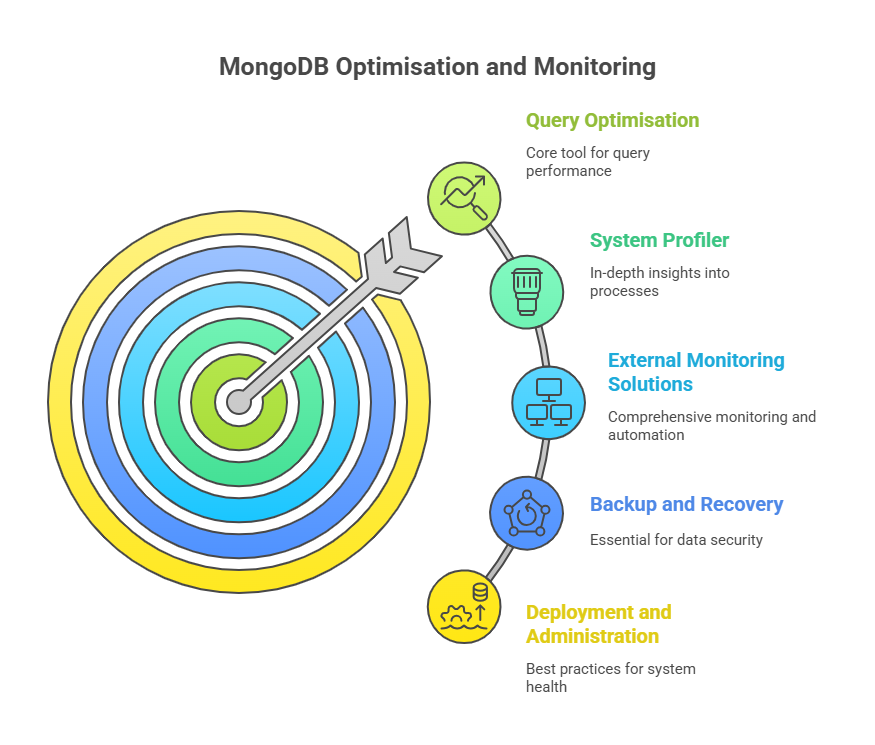
- Query Optimisation: Your main tool for query optimisation and troubleshooting is the explain() method. It displays the query plan, indexes, totalDocsExamined, and execution time (executionTimeMillis). Effective indexes to boost read performance require understanding explain() output.
- System Profiler: You can activate MongoDB’s system profiler, which logs operations in the system.profile collection, to gain more in-depth information about sluggish processes. Although helpful, it can affect performance, therefore production systems should only have it activated at opportune times.
- External Monitoring Solutions: MongoDB can be coupled with external monitoring programs such as Nagios and Munin through open-source plugins for serious deployments. More extensively, MongoDB Cloud Manager and Ops Manager offer a strong array of automation, backup, and monitoring features. They are both offered as hosted services and on-premise solutions, respectively. In addition to providing dashboards and warnings for important data (such as lock percentage, replication lag, and page faults), these tools can help with system information sharing by supporting MongoDB.
- Backup and Recovery: Regular backups are essential for data security. The MongoDB tools mongodump and mongorestore create and restore BSON backups. Another way is to replicate underlying data files (ideally when the server is locked or shut down, or utilising point-in-time snapshots if supported by the volume) or use MongoDB Cloud Manager/Ops Manager backup services.
- Deployment and Administration Best Practices: MongoDB health depends on hardware, provisioning, and security, as well as monitoring. To avoid performance loss from excessive paging, indexes and the working set need enough RAM. C++ is used to write MongoDB, which is actively being developed and compiles on Windows, Linux, and Mac OS X. A popular NoSQL option, it is an open-source document database.