
Debug Node JS in Chrome
Chrome DevTools provides a highly integrated and aesthetically intuitive method for debugging Node.js apps. With a graphical user interface (GUI) substitute that expedites the debugging process, it’s a big improvement over merely using command-line debuggers.
Integrated Debugging via the V8 JavaScript Engine
A significant architectural resemblance between Node.js and Google Chrome Node.js is based on the V8 JavaScript engine is the reason for the smooth debugging experience. Compiling and running JavaScript code, C++ engine. It is the same engine that powers the Chrome web browser’s JavaScript execution.
Debugging a Node.js application generally uses the same powerful debugging tools that web developers use for client-side JavaScript in Chrome’s DevTools because of this shared base. Engineers have worked tirelessly to make the Chrome JavaScript runtime incredibly fast, and Node.js benefits from their efforts. For Node.js versions 6.3.0 and up, the integrated V8 inspector essentially eliminates the need for third-party tools like node-inspector due to the integration’s strength. By eliminating the cognitive strain of alternating between various debugging paradigms, this shared engine enables a more integrated debugging experience.
Graphical Debugging with Chrome DevTools
Debugging Node.js with Chrome DevTools is a simple process that transforms your debugging workflow from a command-line interface to a rich graphical environment. This is how to begin:
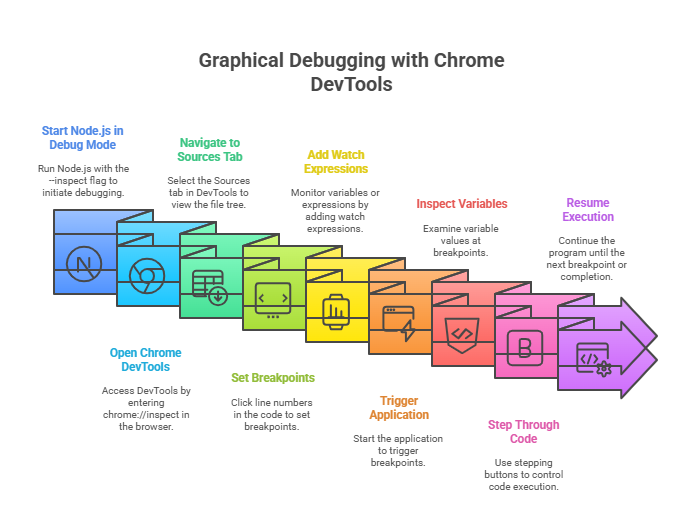
- Start your Node.js application in debug mode: Run your Node.js script from the terminal with the
--inspectflag to start the debugging session. For example, ifserver.jsis your server file, you would run:node --inspect server.jsTo automatically halt execution at the first line of your script, you may also usenode --inspect-brk your-script.jsfor Node.js versions 8 and up. Your terminal will show aws://URL (for example,ws://127.0.0.1:9229/…) when it is executed, indicating that the debug server is listening. By default, this is on port 9229 of your localhost. Publicly exposing this port is not recommended for security reasons. - Open Chrome DevTools: Launch Google Chrome (or Microsoft Edge) and use the address bar to input
chrome://inspect(oredge://inspect) while your Node.js application is in debug mode. This will direct you to a page specifically for inspection. The “Open dedicated DevTools for Node” button is located beneath the “Devices” header. This will open a new DevTools window that is tailored for debugging Node.js. - Navigate to the Sources tab: If the
Sourcestab isn’t already there in the freshly launched DevTools window, pick it. There is a file tree on the left-hand side. To debug your Node.js application, expand it and choose the JavaScript file (server.js, for example) that you want to use. - Set breakpoints: In order to inspect the status of your code, you must set breakpoints, which are essential for stopping its execution at particular moments. Clicking on the line number in the code editor section of Chrome DevTools makes it simple to establish a breakpoint. In order to visually confirm your breakpoint, a red dot will show up next to the line number. Unlike the command-line debugger, you don’t have to manually add
debugger;keywords into your code, which is a big plus. - Add watch expressions (watchers): “Watch expressions” can be used to monitor variables or expressions as your program executes. Find the “Watch” header in the DevTools panel on the right and expand it. After selecting the
+icon, type the variable’s name or any other valid JavaScript expression (e.g.,greetingorword in map), and hit Enter. You will be able to see the values of these watchers at every stage of execution as they update dynamically. - Trigger and step through your application: Click the blue “play” (continue) button in the DevTools interface if your debugger halted at the beginning. Now launch your application in Node.js. To access a web server, you typically need to open a new tab in your browser and navigate to its URL (
http://localhost:8000, for example). Your application will be automatically paused by the DevTools window appearing when the execution approaches a predetermined breakpoint. While this is paused, you can:- Inspect variables: Look at all variables in scope, including your watched expressions, and their current values.
- Step through code: Step your code line by line to get fine-grained control over the flow by using the different stepping buttons (step over, step into, and step out).
- Resume execution: Press the “continue” button to let the program continue until it reaches the subsequent completion or breakpoint.
Advantages of Chrome DevTools Debugging
The following are some strong advantages of this GUI-based method:
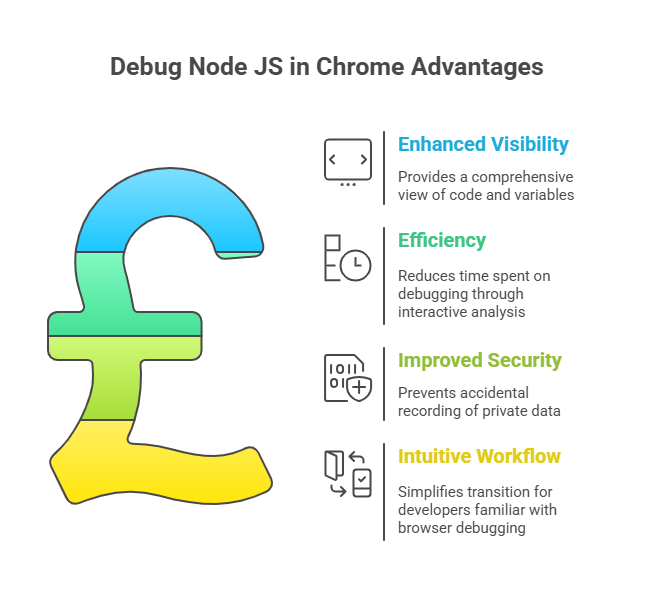
- Enhanced Visibility: Compared to plain text output, the visual aspect of DevTools offers a more comprehensive view of your code, call stack, and variable states.
- Efficiency: The amount of time spent looking for issues is greatly decreased. You may analyse everything interactively and establish dynamic breakpoints rather than tediously adding and deleting
console.log()statements. - Improved Security: By utilising a specialised debugger, you can prevent the possibility of inadvertently recording private data to standard output, which could pose a security concern.
- Intuitive Workflow: By utilising well-known tools and interfaces, switching to Node.js debugging is considerably easier for developers used to browser-based debugging.
In Conclusion
Chrome DevTools to debug Node.js apps offers a strong, integrated, and intuitive environment that makes it easier for developers to find and fix problems quickly, which eventually results in more dependable and strong apps.