
Kibana Data Science Visualization
Data visualization is essential to data science for understanding, interpreting, and presenting insights. Kibana is one of the most powerful and adaptable data visualization tools, especially for large datasets. This post will explain Kibana, its role in data science, and how to use it to create compelling and insightful visualizations.
What is Kibana
The Elastic Stack (formerly ELK Stack) features open-source data visualization tool Kibana. Elasticsearch analyzes and visualizes data with it. Kibana’s easy online interface helps data scientists, analysts, and engineers create bar charts, line graphs, pie charts, heatmaps, and global maps.
Kibana’s capacity to swiftly visualize vast amounts of data is its key draw in data science. Users can drill down, filter, and explore multiple dimensions of the dataset to find hidden patterns and trends using its interactive features.
Key Kibana Features
Before discussing Kibana’s data science applications, let’s review its features:
Real-time Data Analysis: Kibana is intimately connected with Elasticsearch, enabling real-time data search and analysis. Data scientists may perform queries and visualize findings without exporting to other tools.
Variety of Visualizations: Kibana offers bar charts, line graphs, pie charts, histograms, tables, maps, and more. The advanced visualizations Vega and Vega-Lite allow bespoke charts.
Real-time Data Analysis:Kibana is ideal for real-time data analysis. It can view live stream data like logs, metrics, and application data.
Dashboards: Kibana lets users construct personalized dashboards with numerous visualizations. Interactive dashboards show data holistically.
Advanced Search and Querying: Kibana supports LQL and KQL, which enable complicated data queries. You can store and reuse these queries for analysis.
Machine Learning: Kibana’s anomaly detection feature helps users find odd data patterns. Fraud detection, predictive maintenance, and performance monitoring benefit from this.
Alerts and Notifications: Kibana may issue conditional alerts. Kibana is beneficial for operational monitoring and decision-making since users may specify metrics thresholds and be notified if they are exceeded.
Importance of Kibana in Data Science
Data science requires practical insights from vast datasets. Data scientists need visualizations to easily identify trends, relationships, and outliers. The capacity to handle large-scale data and its many visualization choices make Kibana a useful data science tool.
Here are some data science reasons why Kibana is important:
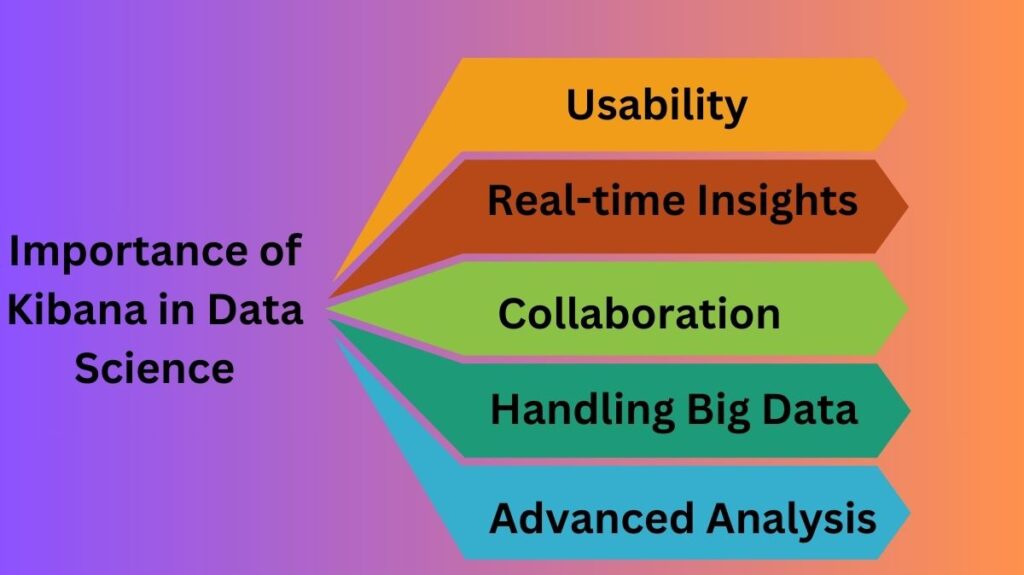
Usability: Kibana’s simple interface lets non-technical people generate visualizations. Data scientists can analyze data without writing sophisticated code. Visualizations are easy to create with the drag-and-drop interface and interactive controls.
Real-time Insights:Real-time insights are crucial in data science initiatives, especially those using time-series data. Kibana lets data scientists analyze real-time sensor, log, and application data. In IoT, cybersecurity, and financial services, rapid action is needed.
Collaboration:Kibana facilitates data scientist and stakeholder collaboration. Sharing visualizations lets teams discuss and comprehend outcomes. Dashboards can also be shared with management and decision-makers to ensure data consistency.
Handling Big Data: Data scientists often work with big datasets that traditional technologies cannot handle. Based on Elasticsearch, Kibana can swiftly analyze and visualize enormous volumes of data. Kibana scales horizontally with Elasticsearch’s distributed architecture, making it appropriate for massive data.
Advanced Analysis: Kibana’s machine learning features allow anomaly identification, trend analysis, and forecasting. Data scientists that want to apply machine learning techniques to their data without using separate visualization tools would find this handy.
Data Visualization with Kibana
Use Kibana in data research by learning how to use the platform and generate great visualizations. Start using Kibana for data visualization with these steps:
- Configure Kibana and Elasticsearch
Elasticsearch is required for Kibana. Elasticsearch stores and analyzes data. Kibana queries and visualizes Elasticsearch data.
After Elasticsearch starts, Kibana can be installed. Elasticsearch and Kibana can be installed on the same or distinct servers. A web browser opens Kibana after installation.
- Elasticsearch data import
Kibana only works with Elasticsearch data. The Elastic Stack’s Logstash, Elasticsearch REST API, filebeat, and other data shipping technologies can all feed Elasticsearch data. - Make Index Patterns
You must define an index pattern in Kibana to display data. An index pattern tells Kibana which Elasticsearch data to query. Elasticsearch index names are used to specify index patterns. - Create visuals
Create visualizations with the index pattern. Kibana has numerous visualizations:
- Value comparison bar charts.
- Line graphs for trend analysis.
- Proportional pie charts.
- Data point intensity heatmaps.
- Geographical maps for location data.
- Click on the “Visualize” tab in Kibana, choose the type of visualization, then configure it by selecting data fields.
- Make Dashboards
Multiple visualizations can be combined into a dashboard. Interactive dashboards let users delve down into specific visualizations to see your data in detail. Real-time metrics monitoring requires dashboards. - Filter and query
Kibana lets you filter and query data. For instance, you can filter data by time range or utilize KQL for more advanced queries. Saving and reusing these queries simplifies analysis replication. - Apply Machine Learning
Kibana’s machine learning helps data scientists find anomalies and trends. These traits can identify outliers, anticipate trends, and more. Analyzing huge, complicated datasets benefits from these skills. - Share dashboards and visualizations
Share your visualizations and dashboards once ready. Kibana lets users embed visualizations in external apps or export them as pictures or PDFs.
Data Science Kibana Best Practices
Consider these best practices to maximize Kibana in data science projects:
Organize Data Effectively:Elasticsearch data should be well-structured and organized. Making Kibana visuals more meaningful will be easy.
Use Time Filters:In data science, time-series data is prevalent. Kibana’s powerful time filter lets you analyze specific time periods. Always use this for time-based data.
Leverage Machine Learning:Use Kibana’s machine learning technologies to analyze your data. Hidden patterns can be found by anomaly detection.
Design Interactive Dashboards: Create interactive dashboards. This lets consumers study the data and acquire insights themselves.
Keep Up: Kibana and the Elastic Stack get new features and upgrades often. Keep up with new releases to use new features.
Conclusion
Data science relies on Kibana to explore, analyze, and visualize huge datasets. Data scientists need it for its Elasticsearch connection, real-time capabilities, and flexible visualization options. Data scientists can use Kibana to find insights, spot patterns, and make data-driven decisions by following this article’s procedures and best practices.